Products · DMS · Net Zero & environment

Net Zero, measured
— not guessed.

Carbon accounting per building by scope, meter readings submitted by the parishes themselves, Energy Footprint Tool returns pre-filled from real data, and progress against the Church of England’s routemap tracked where everyone can see it.

Scope
Emissions per building
Parish
Meter readings via portal
EFT
Returns pre-filled
Map
The diocese, one view
Both sides, one story

Both sides of the product, one story.

The diocese sets the framework; the parishes feed it with readings; the numbers roll up without a spreadsheet in between.

Carbon accounting that stands up.

Annual emissions reports by scope, per building, with configurable carbon factors and fuel types — figures you can defend at synod, not estimates rolled forward from 2019.

Readings from the parishes.

Utility meters per church, with gas and electricity readings submitted by wardens and treasurers through the Parish Portal — and a parish-level Net Zero dashboard so they see their own position too.

The Net Zero map.

Emissions, energy spend, EPC and DEC certificates, Eco Church awards and schools carbon layers on one interactive map of the diocese.

In the detail

The environment picture, joined up.

National tools and datasets connected to your own records — so the annual returns fill themselves and the risks surface early.

Energy Footprint Tool

CofE EFT submissions aggregated and pre-filled from meter data — the annual return becomes a review, not a hunt.

Eco Church sync

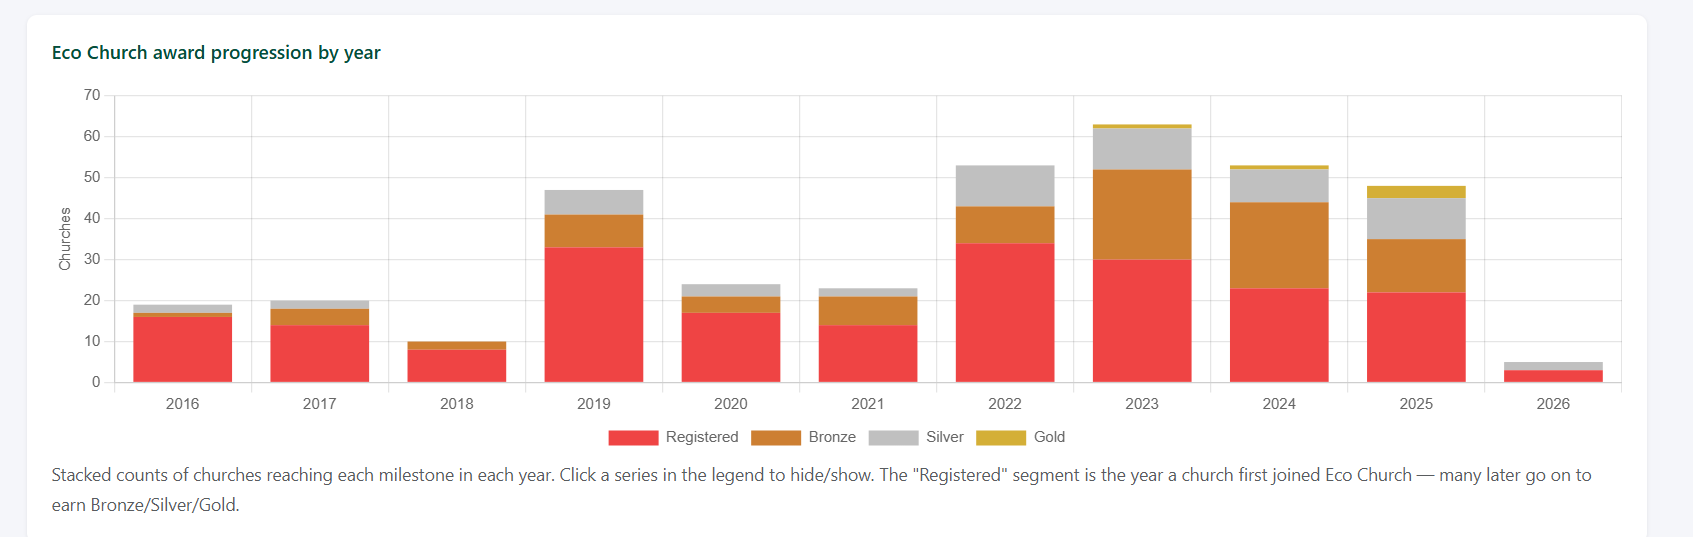
A Rocha award levels updated automatically — bronze, silver and gold across the diocese without a survey.

Routemap tracking

Progress against the Church of England’s Net Zero routemap steps, per church and diocese-wide.

Renewables & retrofit

Renewable assets, retrofit projects and energy audits — with solar-potential estimates from Open-Meteo irradiance data.

Flood alerts

Environment Agency flood-risk warnings matched against church locations — the buildings at risk flagged before the weather arrives.

Schools carbon

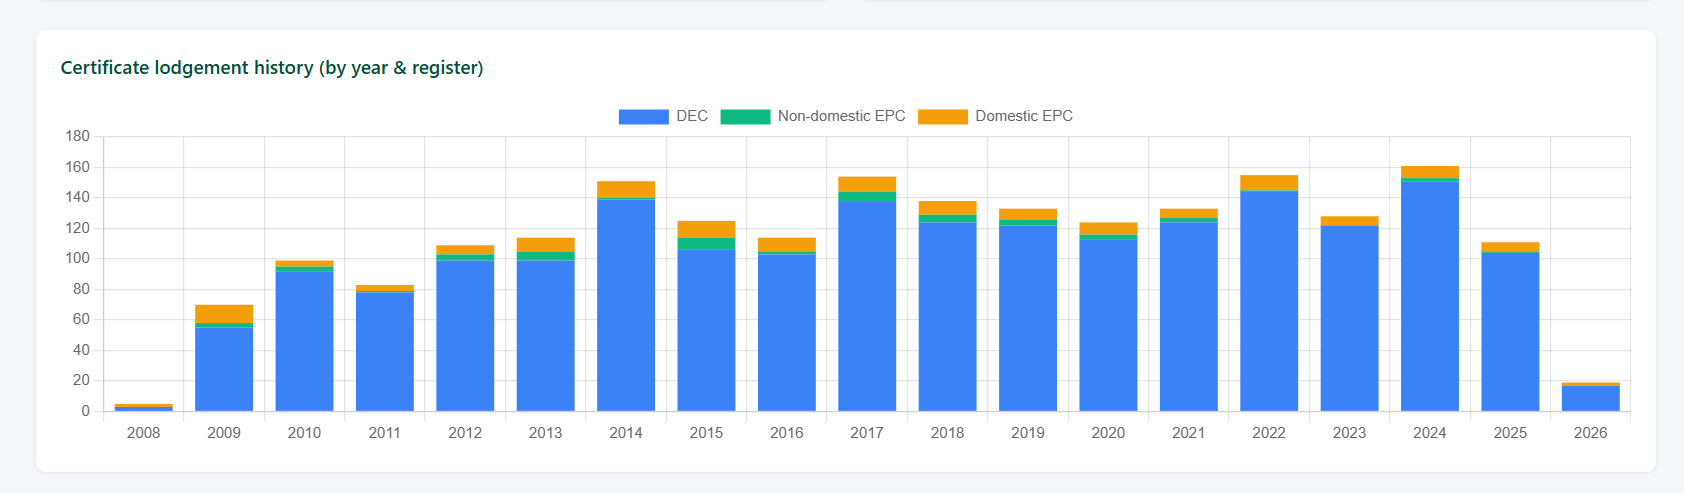
Church school EPCs and carbon certification progress tracked alongside the parishes — the whole estate, not just the churches.

Seen in the product

What it looks like.

Live screens from the platform.

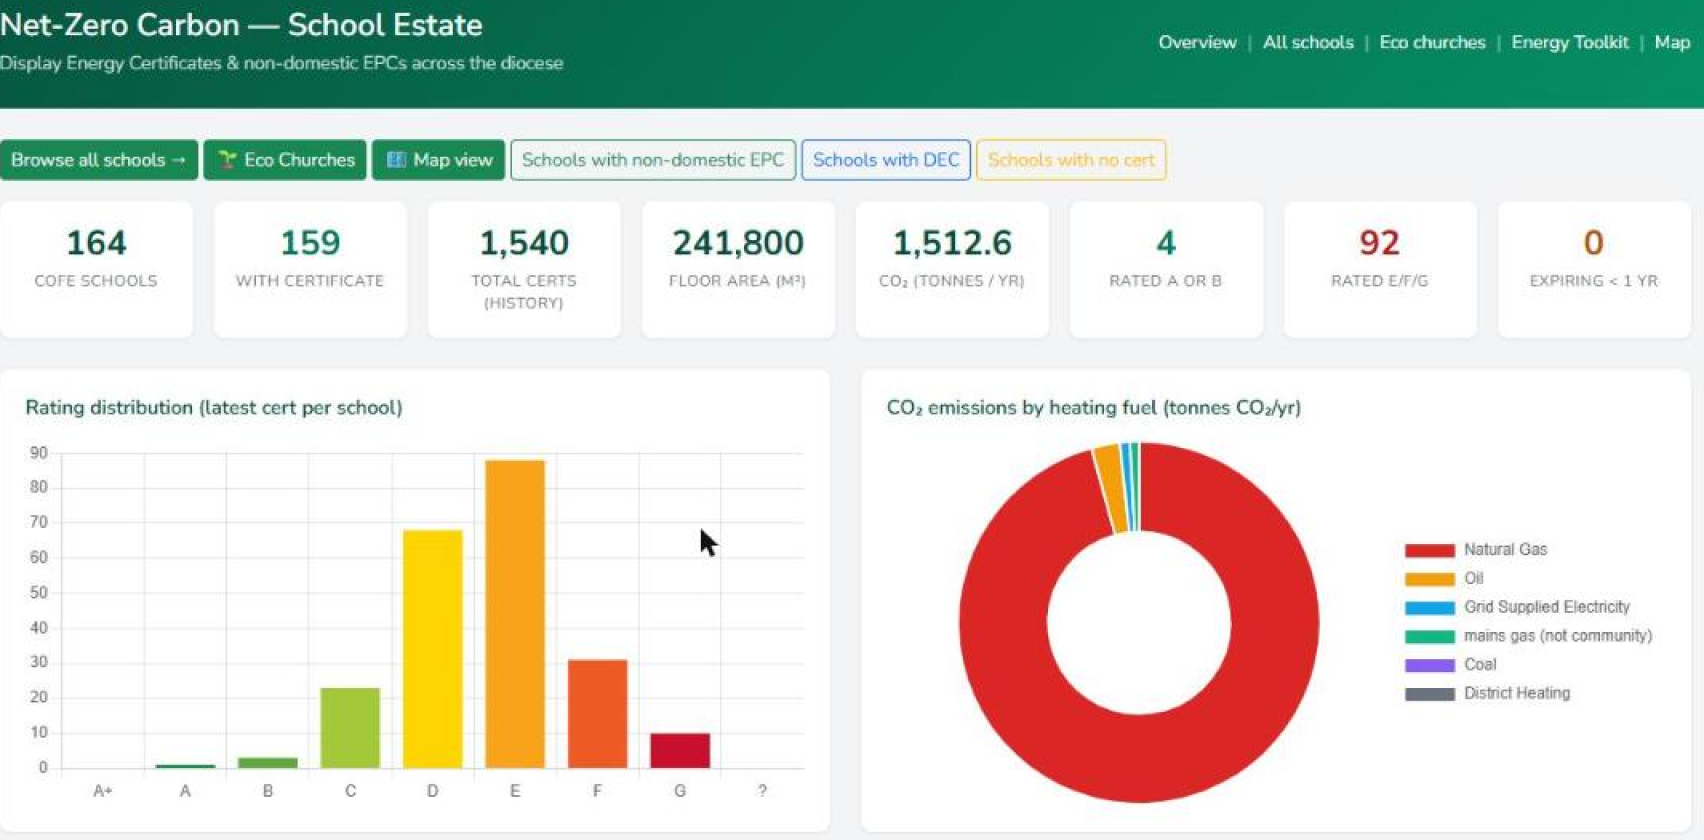
Net zero dashboard for the school estate
Net Zero dashboardCertificates, floor area, tonnes of CO₂ a year and emissions by heating fuel — across the school estate, and the same treatment for churches and clergy housing.
Eco Church progression
Net zero progress detail per building
Building by buildingThe estate broken down to the individual church or house, so a diocesan target becomes a list of actual jobs.
Eco Church progressionA Rocha award levels across the diocese, synced automatically.
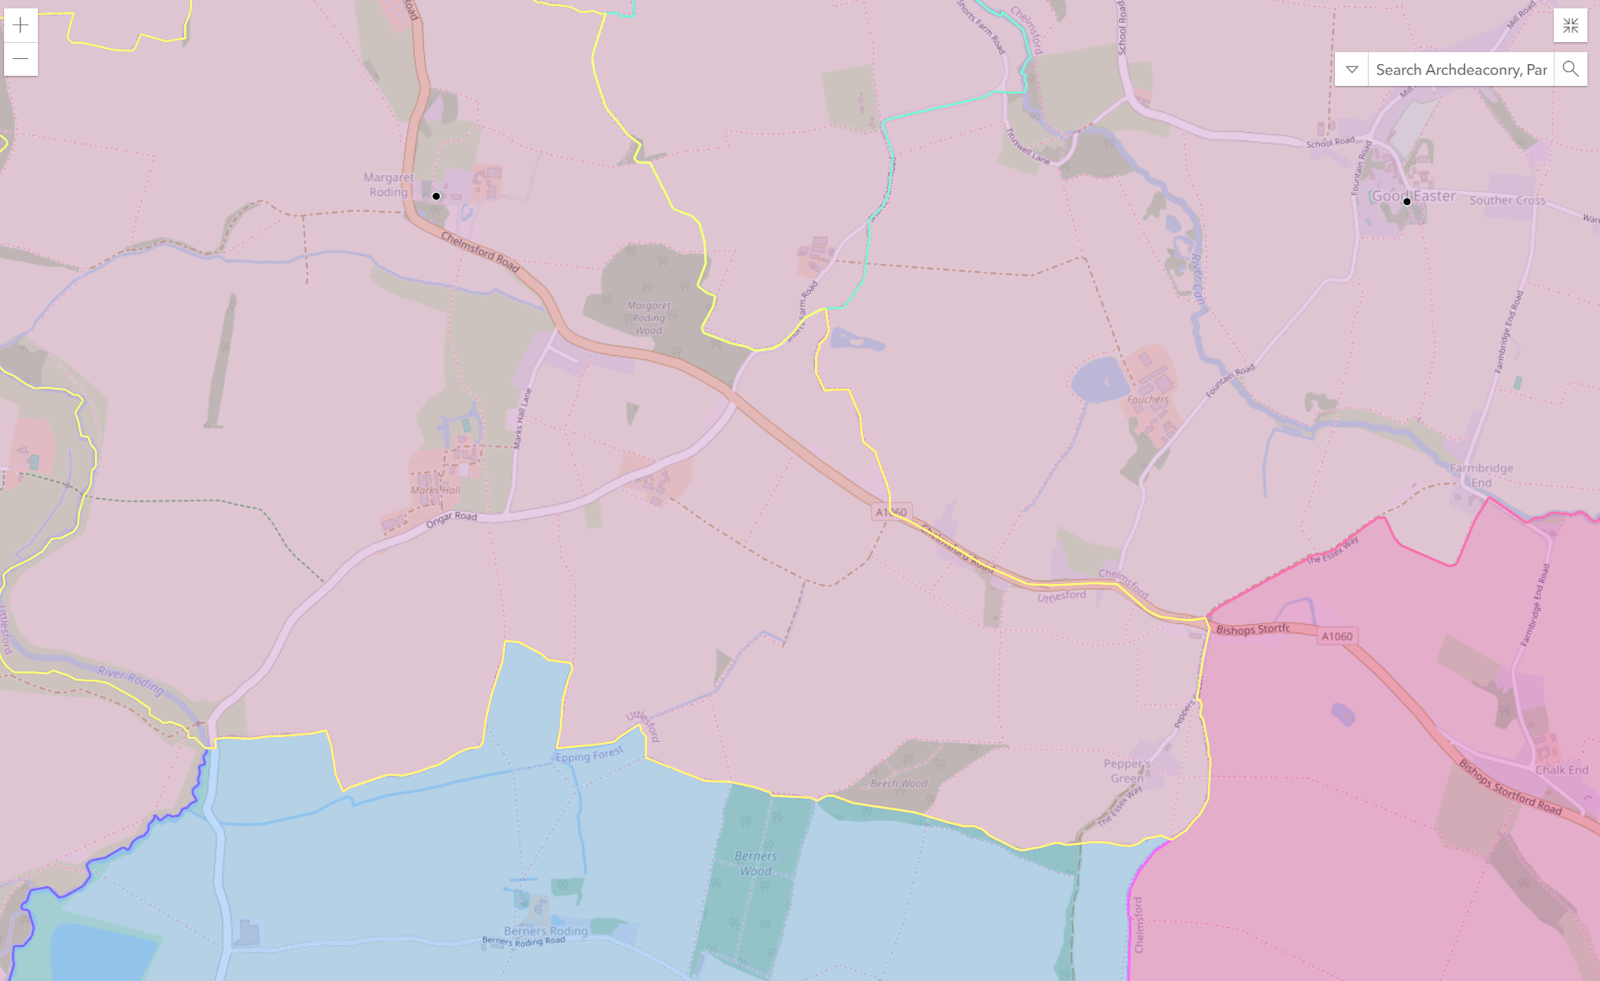
Diocese map view
Map viewsParish and church layers on national boundary data.
The whole estate

Churches, schools and houses in one carbon picture.

Leaving any of the three out understates the diocesan figure substantially.

School energy & EPC

Display Energy Certificates and non-domestic EPCs across the church school estate, with floor area, ratings and CO₂ by heating fuel. Schools are often the largest buildings a diocese has influence over.

Clergy housing

Parsonages carry the same certificate and energy logic as church buildings, so the housing stock is in the figure rather than beside it.

Factor years recorded

Emissions factors are versioned and the factor year is recorded per calculation, so a footprint computed this year does not silently change when national factors are reissued.

It joins up with the property system

Where a diocese also runs the HCOMS property platform, the two read the same places, people and compliance calendar. A parsonage is one property with one address, one occupant, one gas certificate and one EPC, whichever system you arrive from. See Property →

You can’t manage a carbon footprint you only estimate once a year.
— The Net Zero area connects meter readings, certificates and the routemap in one place
Next step

See your diocese
on the map.